
The True Purpose of Chess and How It Really Helps in Pattern Thinking
Chess makes us think like strategists and also helps us think in patterns. First, don't let these thoughts occupy you while playing, because you will gradually understand what skills you are gaining while playing chess and learn how to apply them in programs — and even in real life.
There are 3 crucial things we do to win, or rather, rules of chess make us do.
- Analyzing the opponent's move
- Calculating our possible moves
- Picking the move (right / wrong) within limited time
These three can be applied in real life like this:
- Analyzing the current problem / conflicts / needs
- Listing out the actions we can take
- Picking the right action within limited time
This literally helps us make decisions within a limited time. Whether you play chess for fun or are getting good at it as a cool hobby, you will eventually gain quick decision-making skills. And this helps you think in patterns, as you've moved those pieces more than a thousand times in the game — but applying it in real life is the real challenge.
You don't have to be a pro in chess to do this. Just apply the 3 steps in every critical situation. "Play the game in real life, find your own pattern, and follow what works for you."
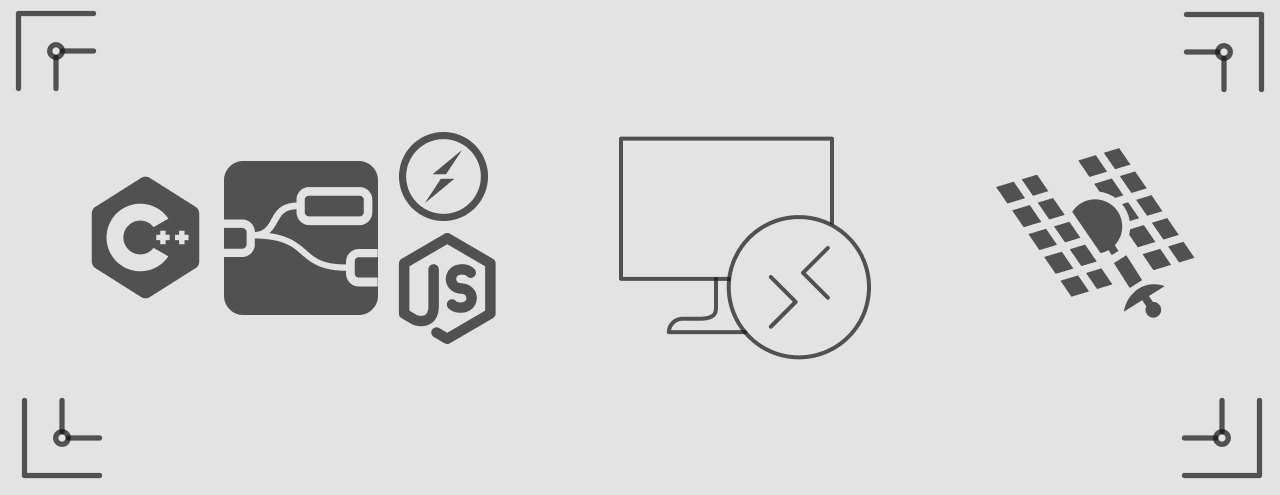
How I built it - CANSAT GUI
The Beginning
As I joined the team, I was instructed to build the GUI using pyQt or even C++, because that's the usual way to build a GUI that connects with hardware components (Teensy 4.1 microcontroller, BME, BMP, IMU and other sensors, resistors, capacitors, etc.) which communicate through an XBee module for long-distance communication over about 1000m. All of this setup connects to the laptop running the GUI via USB cable.
This is the Actual flow
Web GUI & Design phase
But I didn't want to switch to Python or C++/Qt at that time, so I thought: what if I made this a web GUI? Yes, it's possible, it has more features, and the community support is huge.
I started designing the GUI pages in Figma, figuring out what was essential and how to organize the telemetry data and visualize it in a meaningful way. So I categorized each telemetry data into sections such as:
- Home page (contains all telemetry data)
- Primary Sensors (crucial telemetry data for the competition)
- Location (telemetry data related to geo-location)
- Orientation (data related to satellite orientation)
- Communication (data related to communications)
Implementation Phase
After completing the design and organizing the necessary assets, I planned how to implement it (the hardest part, to be honest).
I asked people on Discord how to implement this web-based GUI and also asked in subreddits for help.
One person responded well and helped build the frontend. I used HTML, Tailwind CSS, and packages such as Socket.IO client, Chart.js, Leaflet.js, and Three.js for data visualization, all added via CDN for simplicity. Then I optimized the frontend visualization by swapping in a package more suitable for telemetry. That swap really made a great difference — ApexCharts <-> Chart.js. Because ApexCharts didn't support 10Hz speed, and even when it did, the visualization was too slow or got stuck at moments.
Now to the backend — this part was supposed to be done first, but my lack of knowledge at that time made me lean toward the frontend. But now I realize backend suits me a lot. So I started learning backend concepts and then chose Node.js, for one reason: I didn't want to switch languages. Then the important concepts came into play: events, eventListener, eventEmitter, Web Sockets, Socket.io.
Testing phase & Conclusion
After this, I spent my time testing and integrating the parts we built. I wrote more try, catch, throw as I found more edge cases during testing, and finally organized the folder structure and made it to the competition. As expected, all the other competitors built their GUI using either PyQt or C++/Qt. It doesn't matter which stack you use — it's up to us developers to make it better. The flow I made is below:
Should we use AI to code or do it ourselves
There are two sides to this:
- Business-oriented — use AI for a productivity-rich workflow: implement and fail fast, iterate until the best outcome, automate tasks, and focus on designing the architecture of the system.
- From some experienced developers' POV — don't let slop code enter your codebase, and use your brain to think and code.
I think I can draw the line: use AI to code, but do the thinking yourself. Another thing — you have to understand what the code actually does before pushing it or adding a new feature.
We can't totally neglect AI — it is really useful for boilerplate code and also good at teaching. If privacy is a concern, we can move to local LLMs, but the cost is literally huge for the GPU and computing power. My work isn't that secret, so I choose the normal path. I use OpenCode and Herdr with free AI models, since my use cases never exceeded that need. I'm also trying to use the bmad-method for the agents & skills and customize them to my use cases. In the future I'll try to add my workflow here.
As a Backend Engineer, I prefer to focus on the logic and content of this site, so I use AI for repetitive frontend work like making the layout responsive. I wouldn't let AI write the content of this site — I use it for boring work and never let it touch the organic content and creative thinking process.
Being an extremist never ends well, and we've seen this pattern in history many times. So learn to be in the gray area.
FTTA - Building a Faculty Time Tracking Application for 500+ Users
Most private institutions still track faculty attendance on paper or in messy spreadsheets. FTTA was built to fix that. It's a full-stack web application that lets the admin monitor faculty availability, track their sessions, and keep student attendance records - all from a single dashboard.
The core requirement was access control. Only emails from the organization's allowed domains can log in, implemented with Google OAuth 2.0 and role-based access control (RBAC) through Passport.js. Admins see everything; faculty log their sessions and student details.
It's running in production right now with 500+ active users, deployed using Docker, Vercel and Heroku. The codebase is currently closed source.
IMDF - A REST API to Filter Images by their Metadata
Image Meta Data Filter (IMDF) is a REST API that stores images in the cloud and lets you filter them by the metadata embedded in the files - geo-location, capture date, device name and more.
Uploads are handled with Multer, files are stored in Cloudinary, and the metadata is persisted in MongoDB. The API is built with Node.js and Express, and deployed using Docker and Render.
The server-side logic stays simple: extract the metadata on upload, store it alongside the file reference, and return filtered results based on query parameters.